In the figure given below, D₁ and D₂ represent the demand curves for land before and after the ethanol program respectively.SRS is the short-run supply curve of land.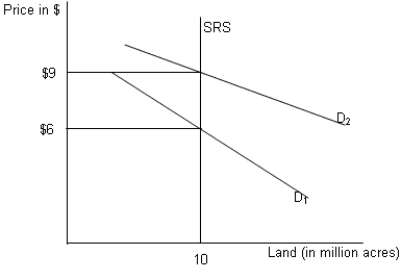
-Refer to Figure .What will be the impact of the ethanol program on the long-run equilibrium price level for land suitable for corn cultivation?
A) The price level will settle between $6 and $9.
B) The price level will settle at $6.
C) The price level will settle at $9.
D) The price level will be above $9.
Correct Answer:
Verified
Q51: Which of the following products witnessed a
Q52: Assume that the world price of Good
Q53: Suppose the cost of raw materials used
Q54: Suppose a legislation passed by the government
Q55: How is the short run response to
Q57:
In the figure given below,
Q58: If firms in a perfectly competitive market
Q59: Which of the following commodities have a
Q60: Suppose beer producers in Munich became aware
Q61: State two characteristics of the long-run equilibrium
Unlock this Answer For Free Now!
View this answer and more for free by performing one of the following actions

Scan the QR code to install the App and get 2 free unlocks

Unlock quizzes for free by uploading documents