The figure given below represents the total output and price produced in an oligopoly market characterized by a dominant firm and a fringe.SF represents the supply curve of the fringe, D is the market demand curve, DRES represents the residual demand curve of the dominant firm, MRRES represents the residual marginal revenue curve of the dominant firm, and MCD represents the marginal cost of the dominant firm.
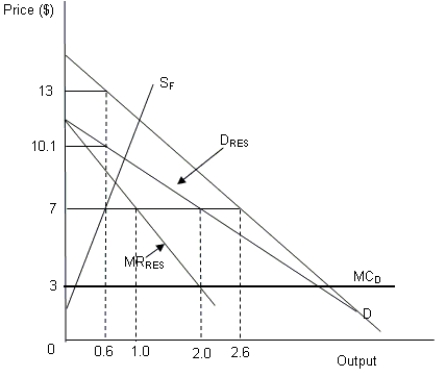
-Refer to Figure .What will be the fringe's profit maximizing output?
A) 0.6 unit
B) 0.3 unit
C) 1.6 units
D) 2.6 units
Correct Answer:
Verified
Q17: The demand curve faced by a dominant
Q18: In finitely repeated price-fixing game, the dominant
Q19: An oligopoly market is characterized by limited
Q20: In the long run, if new fringe
Q21: Suppose the market demand curve (D) in
Q23: An agreement between the dominant firm and
Q24: The figure given below represents the total
Q25: The following matrix represents the payoffs to
Q26: The following matrix represents the payoffs to
Q27: The following matrix represents the payoffs to
Unlock this Answer For Free Now!
View this answer and more for free by performing one of the following actions

Scan the QR code to install the App and get 2 free unlocks

Unlock quizzes for free by uploading documents