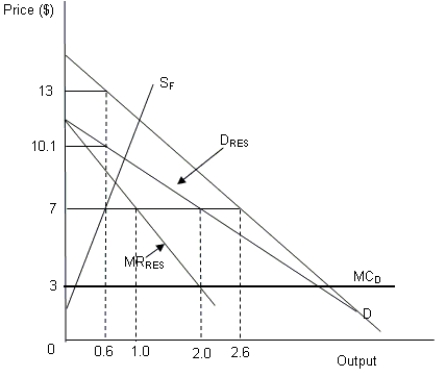
The figure given below represents the total output and price produced in an oligopoly market characterized by a dominant firm and a fringe.SF represents the supply curve of the fringe, D is the market demand curve, DRES represents the residual demand curve of the dominant firm, MRRES represents the residual marginal revenue curve of the dominant firm, and MCD represents the marginal cost of the dominant firm.
-Refer to Figure .Assume that in the long run new firms enter the market lowering the total cost incurred by the fringe firms below the same incurred by the dominant firm.Which of the following situations will arise?
A) The fringe supply will rotate leftward and downward reducing its profit.
B) The dominant firms market share and profit will both increase.
C) The dominant firm will be totally displaced by the fringe.
D) The fringe's market power will decrease.
Correct Answer:
Verified
Q26: The following matrix represents the payoffs to
Q27: The following matrix represents the payoffs to
Q28: Assume that in a price-fixing game, if
Q29: The principle of backward induction proves that
Q30: The figure given below represents the total
Q32: The figure given below represents the total
Q33: The figure given below represents the total
Q34: A gaming strategy in which one player
Q35: The figure given below represents the total
Q36: High barriers to entry protect the market
Unlock this Answer For Free Now!
View this answer and more for free by performing one of the following actions

Scan the QR code to install the App and get 2 free unlocks

Unlock quizzes for free by uploading documents