The figure given below represents a firm in a market characterized by many buyers and one seller.MC represents the marginal cost, MR the marginal revenue, and D the demand curve of a firm.The firm is initially in equilibrium producing 6 units of output at a price of $10 per unit.
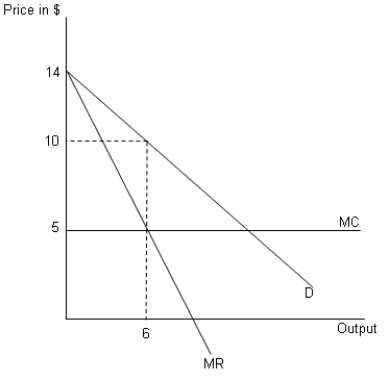
-Refer to Figure .Suppose the adoption of a new technology lowers the cost of production while the buyer's valuation remains unchanged.Which of the following changes will be observed by the firm?
A) The demand curve for its product will shift to the left.
B) The marginal cost curve will shift downward.
C) The equilibrium output of the firm will fall below 6 units.
D) The marginal revenue curve will shift downward.
Correct Answer:
Verified
Q19: Which of the following is a reason
Q20: Large firms that invest in specific assets
Q21: The figure given below represents a firm
Q22: Under a _, the assets of two
Q23: The difference between opportunity cost of the
Q25: In the figure given below, Panel A
Q26: If two small perfectly competitive firms merge,
Q27: The figure given below represents a firm
Q28: Which of the following is an example
Q29: In a market characterized by many buyers
Unlock this Answer For Free Now!
View this answer and more for free by performing one of the following actions

Scan the QR code to install the App and get 2 free unlocks

Unlock quizzes for free by uploading documents