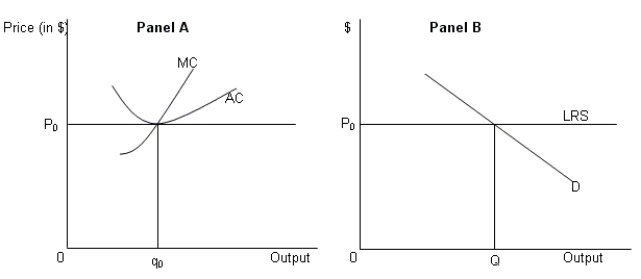
In the figure given below, Panel A represents preexisting firms which are in long run equilibrium at price P₀ and output q₀.MC and AC represents the marginal cost and the average cost of the preexisting firms.Panel B represents a market where every seller has the smallest ability to affect prices.The market is in equilibrium at price P₀ and output Q shown by the intersection of the long-run supply curve (LRS) and market demand (D) .
-Refer to Figure .If a preexisting firm adopts a new cost effective technology (which reduces production costs) .Which of the following changes will be observed?
A) The price level in the market will shift upward.
B) The market demand curve will shift to the right.
C) The LRS curve will shift upward.
D) The MC and AC curves of the innovative firm will shift downward.
Correct Answer:
Verified
Q25: In the figure given below, Panel A
Q26: If two small perfectly competitive firms merge,
Q27: The figure given below represents a firm
Q28: Which of the following is an example
Q29: In a market characterized by many buyers
Q31: Under which of the following situations would
Q32: The figure given below represents a firm
Q33: In the figure given below, Panel A
Q34: Suppose the cost of producing cellular phones
Q35: The figure given below represents a firm
Unlock this Answer For Free Now!
View this answer and more for free by performing one of the following actions

Scan the QR code to install the App and get 2 free unlocks

Unlock quizzes for free by uploading documents