The figure given below represents two monopolists James and Jerry.James produces Good A using the input Good B which is produced by Jerry and has no other variable costs.James is the only consumer of Good B, and the marginal cost incurred by Jerry to produce Good B is zero.DA and DB represent the demand curves for Good A and Good B respectively.MRA and MRB represent the marginal revenue received from Good A and Good B respectively.It takes one unit of A to produce a unit of B.
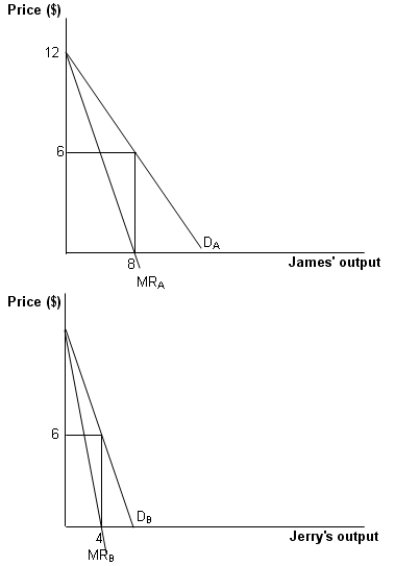
-Refer to Figure.What would be Jerry's profit maximizing price-output combination if the two monopolists do not cooperate?
A) 4 units at $9 each
B) 4 units at $3 each
C) 4 units at $6 each
D) 8 units at $6 each
Correct Answer:
Verified
Q33: Which of the following is an advantage
Q34: _ increases with the variability of outcomes
Q35: The figure given below represents two monopolists
Q36: The figure given below represents two monopolists
Q37: According to the text, which of the
Q39: The maximum price pipelines can charge for
Q40: If there is a low degree of
Q41: Which of the following observations about outsourcing
Q42: Firms generally prefer not to outsource product
Q43: Which of the following changes can facilitate
Unlock this Answer For Free Now!
View this answer and more for free by performing one of the following actions

Scan the QR code to install the App and get 2 free unlocks

Unlock quizzes for free by uploading documents