The figure given below represents two monopolists James and Jerry.James produces Good A using the input Good B which is produced by Jerry and has no other variable costs.James is the only consumer of Good B, and the marginal cost incurred by Jerry to produce Good B is zero.DA and DB represent the demand curves for Good A and Good B respectively.MRA and MRB represent the marginal revenue received from Good A and Good B respectively.It takes one unit of A to produce a unit of B.
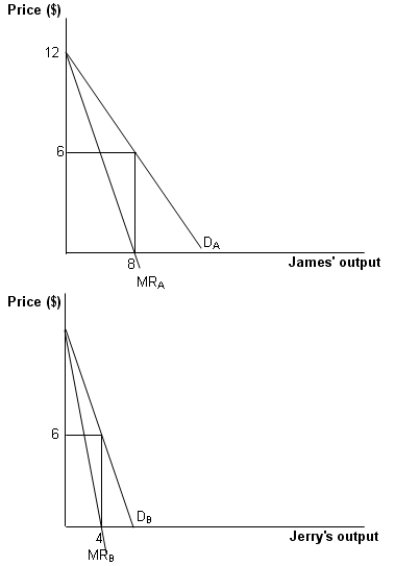
-Refer to Figure .Calculate the profit earned by James in the absence of cooperation between the two monopolists.
A) $24
B) $12
C) $6
D) $36
Correct Answer:
Verified
Q25: Successive monopolies face the problem of:
A)double marginalization.
B)volumetric
Q26: The figure given below represents two monopolists
Q27: During the peak season, when demand for
Q28: A monopolistic producer supplying raw materials to
Q29: If assets are relatively _, and uncertainty
Q31: Which of the following properties is seen
Q32: A firm chooses vertical integration to reduce
Q33: Which of the following is an advantage
Q34: _ increases with the variability of outcomes
Q35: The figure given below represents two monopolists
Unlock this Answer For Free Now!
View this answer and more for free by performing one of the following actions

Scan the QR code to install the App and get 2 free unlocks

Unlock quizzes for free by uploading documents