Multiple Choice

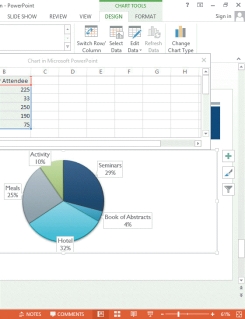
-Referring to the accompanying illustration, each slice of the pie chart represents _____.
A) a data series
B) a data set
C) a category of data
D) a data topic
Correct Answer:
Verified
Related Questions
Q18: A spreadsheet, called a(n) graphsheet in Microsoft
Q19: Color saturation is the amount or intensity
Q20: To add a sound clip to a
Q21: ![]()

