The graph that best depicts the seasonal variability in precipitation found in the wet-dry tropical precipitation regime is number ____. 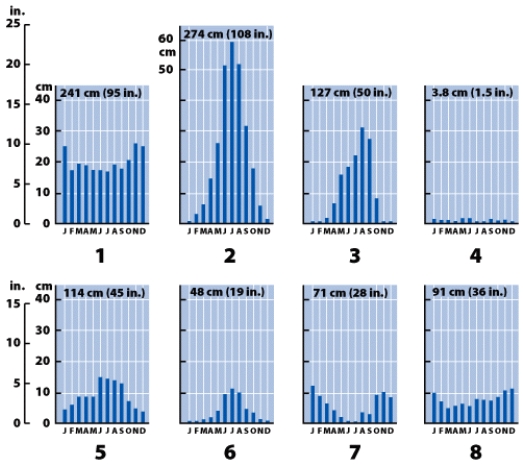
A) 1
B) 2
C) 3
D) 4
Correct Answer:
Verified
Q65: The graph that best depicts the seasonal
Q66: The air mass source region labeled 2
Q67: The graph that best depicts the seasonal
Q68: The air mass(es)important to the moist continental
Q69: The high-latitude climates coincide with:
A)the belt of
Q71: The air mass source region labeled 4
Q72: In the United States, the moist continental
Q73: The graph that best depicts the seasonal
Q74: The graph that best depicts the seasonal
Q75: The air mass source region labeled 3
Unlock this Answer For Free Now!
View this answer and more for free by performing one of the following actions

Scan the QR code to install the App and get 2 free unlocks

Unlock quizzes for free by uploading documents