Assume that this graph illustrates a perfectly competitive labor market. 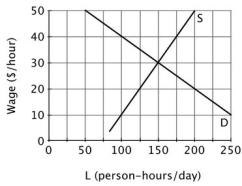 Equilibrium in this labor market is at a wage of ________ per hour and an employment level of ________ person-hours per day.
A) $30; 100
B) $30; 150
C) $20; 200
D) $20; 125
Correct Answer:
Verified
Q46: Suppose it is observed that the equilibrium
Q47: Suppose that this graph describes the current
Q48: Suppose that this graph describes the current
Q49: A reduction in workers' marginal productivity would
Q50: If the labor market for doctors is
Q52: Assume that the graph below describes the
Q53: The value of marginal product curve is
Q54: A decrease in demand for a firm's
Q55: If technological developments increase the marginal product
Q56: Assume that the graph below describes the
Unlock this Answer For Free Now!
View this answer and more for free by performing one of the following actions

Scan the QR code to install the App and get 2 free unlocks

Unlock quizzes for free by uploading documents