Examine the following graph.This graph shows that the 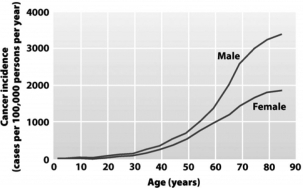
A) rate of cancer diagnosis increases for both genders with increasing age.
B) mortality rate for cancer increases more rapidly in older men than in older women.
C) probability of acquiring cancer for both genders becomes greater than 50 percent after age 80.
D) majority of individuals living to age 80 or beyond will be diagnosed with cancer.
Correct Answer:
Verified
Q12: Examine the following diagram.Which is most likely
Q13: A tumor suppressor is a(n)
A) negative growth
Q14: When a mutant receptor protein no longer
Q15: A tumor that has gained the ability
Q16: Examine the following diagram.Which is most likely
Q18: As indicated in the following diagram,the transforming
Q19: For cancer to form in the presence
Q20: Examine the following diagram.Which is most likely
Q21: The cells in many late-stage precancerous polyps
Q22: A pesticide was found to cause cancer
Unlock this Answer For Free Now!
View this answer and more for free by performing one of the following actions

Scan the QR code to install the App and get 2 free unlocks

Unlock quizzes for free by uploading documents