Why have the two plant populations depicted in the following diagram become so different in the time they were separated by the ocean? 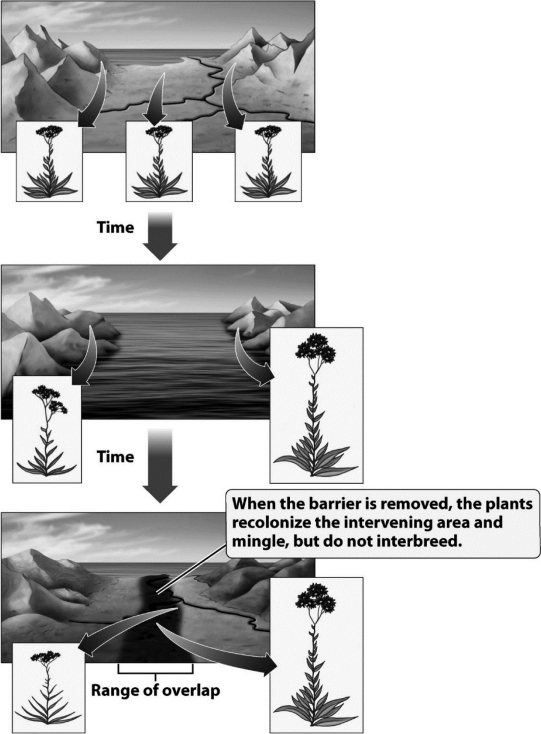
A) A small group of individuals carrying only the tall allele established a new population on the right side of the ocean.
B) The amount of gene flow between the two populations increased when the ocean separated the plants, so mutations moved from one population to another.
C) When sea levels rose, it killed all of the plants on the right side of the figure. A new species evolved from another plant species already existing in the mountains on the right.
D) The separated populations adapted to the different environments on each side of the ocean and became reproductively isolated.
Correct Answer:
Verified
Q14: The fossils of two adult birds are
Q15: Individuals of the same species generally
A) experience
Q16: The distance needed for geographic isolation is
A)
Q17: Which of the following is an example
Q18: Geographic isolation limits the _ between populations
Q20: The willow flycatcher and the least flycatcher
Q21: The following pictures show a shark,which is
Q22: Polyploidy can lead to very rapid speciation
Q23: Grizzly bears,whales,mice,and humans are very different genotypically
Q24: Sympatric speciation
A) occurs only in plants.
B) is
Unlock this Answer For Free Now!
View this answer and more for free by performing one of the following actions

Scan the QR code to install the App and get 2 free unlocks

Unlock quizzes for free by uploading documents