The following graph shows the growth of a Paramecium population. 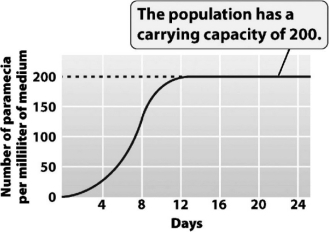 The greatest amount of daily growth occurred when the population was at approximately ________ percent of its carrying capacity.
A) 10
B) 25
C) 50
D) 100
Correct Answer:
Verified
Q33: The Rapanui people initiated the environmental disasters
Q34: Examine the following graph,which shows the relationship
Q35: Density-dependent factors are more likely to limit
Q36: The effects of pollution are generally considered
Q37: The top of the "S" in an
Q39: As a component of its solution for
Q40: The following figure shows that the human
Q41: The type of growth that occurs when
Q42: A group of interacting individuals of the
Q43: When population size is high,the rate of
Unlock this Answer For Free Now!
View this answer and more for free by performing one of the following actions

Scan the QR code to install the App and get 2 free unlocks

Unlock quizzes for free by uploading documents