Examine the following graph; what best describes the cycling that each population experiences? 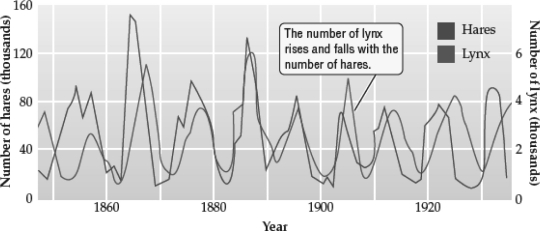
A) Lynx populations decrease in size when hare populations increase in size; hares are the superior competitors.
B) Lynx populations increase in size when hare populations decrease in size; lynx are the superior competitors.
C) Lynx populations decrease in size when hare populations decrease in size; lynx are exploiting the hare population.
D) The increase and decrease of each species is driven by oscillating density-independent factors, but since they share the same habitat, the cycles coincide.
Correct Answer:
Verified
Q35: A praying mantis captures and devours many
Q36: Female ducks frequently deposit fertile eggs in
Q37: In _ competition,species compete indirectly for a
Q38: Herbivores interact exploitatively with the plants they
Q39: Which of the following statements about competition
Q41: Once a mature community develops,is it likely
Q42: The removal of a keystone species from
Q43: The process that establishes new communities and
Q44: As shown in the following graph,selected intertidal
Q45: During _,a newly created habitat is inhabited.
A)
Unlock this Answer For Free Now!
View this answer and more for free by performing one of the following actions

Scan the QR code to install the App and get 2 free unlocks

Unlock quizzes for free by uploading documents