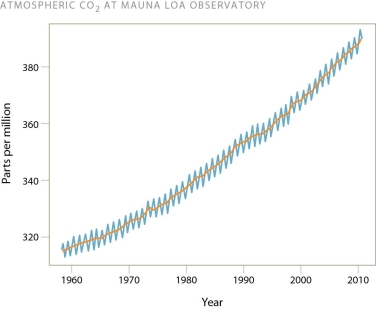
-The general pattern in this figure reveals increasing levels of carbon dioxide in the atmosphere over the past fifty years.Why is the red line wavy and the blue line steadily increasing?
A) The red line drops in the winter when photosynthesis decreases.
B) The red line increases in the summer when people are more likely to run their air conditioners.
C) The blue line reflects changes in temperature while the red line represents changes in carbon dioxide levels.
D) The red line reflects changes in the ocean levels that occur when carbon dioxide levels are higher.
Correct Answer:
Verified
Q20: Every day,tremendous amounts of the sun's energy
Q21: Which one of the following best illustrates
Q22: Which of the following gases by virtue
Q23: Which of the following activities have contributed
Q24: In our world,something with the greatest heat
Q26: Using ice core samples and analyses,researchers have
Q27: The 2007 Panel on Climate Change (IPCC)reported
Q28: In his movie,An Inconvenient Truth,Al Gore warns
Q29: In general,temperatures along an ocean coastline vary
Q30: Evidence from proxies indicate eight major oscillations
Unlock this Answer For Free Now!
View this answer and more for free by performing one of the following actions

Scan the QR code to install the App and get 2 free unlocks

Unlock quizzes for free by uploading documents