This graph depicts a ________,which is a set of estimates that would be observed from a large number of independent samples that are all the same size and drawn using the same method.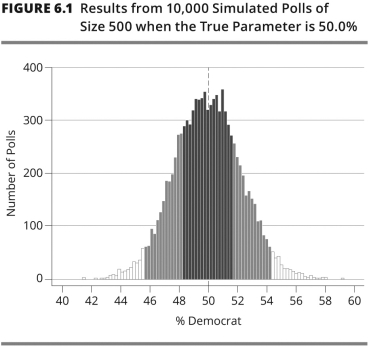
A) confidence interval
B) confidence level
C) population distribution
D) sampling distribution
Correct Answer:
Verified
Q1: The most commonly used value for confidence
Q3: Megan is collecting data for a research
Q4: For which study would you recommend that
Q5: In a _ sample,each individual and each
Q6: According to the Gallup-Healthways Well-Being Index,33.3% of
Q7: Dr.Luther has accessed a list of all
Q8: Maya has created a sample in which
Q9: A sports website has a poll on
Q10: The _ refers to the probability that
Q11: _ error refers to the difference between
Unlock this Answer For Free Now!
View this answer and more for free by performing one of the following actions

Scan the QR code to install the App and get 2 free unlocks

Unlock quizzes for free by uploading documents