This table depicts a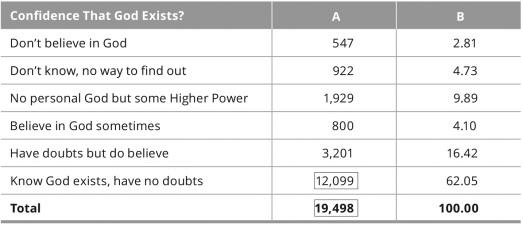
A) standard deviation.
B) regression coefficient.
C) measure of central tendency.
D) frequency distribution.
Correct Answer:
Verified
Q8: In this table,Column A indicates the _
Q9: Monique has collected data on how frequently
Q10: Willow has collected information from 12 members
Q11: You are curious about color preference among
Q12: Julia has collected data on how students
Q14: How does univariate analysis differ from bivariate
Q15: Dr.Liu wants to learn how well the
Q16: This graph displays a _ distribution.
Q17: Bita has asked a sample of 50
Q18: A _ is the most fundamental concept
Unlock this Answer For Free Now!
View this answer and more for free by performing one of the following actions

Scan the QR code to install the App and get 2 free unlocks

Unlock quizzes for free by uploading documents