The graph shown indicates the incidence of whooping cough in the United States.What information can you determine from this graph?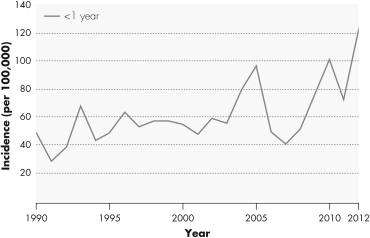
A) There was a decline in vaccination rates of infants under one year of age during the early 1990s.
B) The incidence of whooping cough in infants under one year of age was declining prior to 1990.
C) Waning immunity in adult populations has led to an increase in whooping cough.
D) The incidence of whooping cough in infants under one year of age was higher in 2010 than it was in 1995.
Correct Answer:
Verified
Q24: Which of the following organisms is an
Q27: A day-care worker reports that two young
Q30: Due to the location of infection,bacterial sinusitis
Q32: A young boy with a sore throat,cervical
Q34: A patient with a respiratory infection who
Q35: The most prevalent form of cryptococcosis is
Q37: Respiratory syncytial virus and influenza are responsible
Q39: Close contact with respiratory droplets from which
Q39: This figure shows the relative incidence of
Q56: The ciliated epithelium in the respiratory tract
Unlock this Answer For Free Now!
View this answer and more for free by performing one of the following actions

Scan the QR code to install the App and get 2 free unlocks

Unlock quizzes for free by uploading documents