Multiple Choice
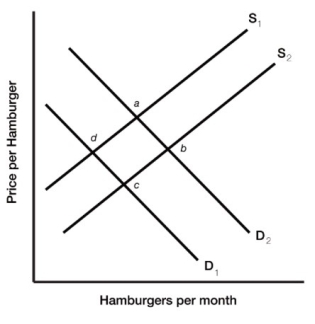 Figure 3.5
-Figure 3.5 illustrates a set of supply and demand curves for hamburgers. A decrease in demand and a decrease in quantity supplied are represented by a movement from
A) point c to point a.
B) point a to point c.
C) point b to point c.
D) point d to point b.
Correct Answer:
Verified
Related Questions
Q103: An increase in supply of a product
Q106: The price of pineapples has risen dramatically.
Q119: Describe the changes in the variables that

