Multiple Choice
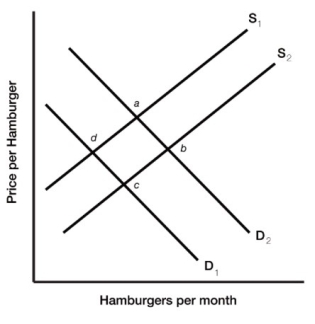 Figure 3.5
-Figure 3.5 illustrates a set of supply and demand curves for hamburgers. An increase in supply and a decrease in demand are represented by a movement from
A) point d to point b.
B) point d to point a.
C) point a to point c.
D) point b to point d.
Correct Answer:
Verified
Related Questions
Q122: If producers have an expectation of higher
Q124: Suppose that in October the price of
Q125: If the demand for jelly decreases, and
Q128: Bananas and apples are substitutes. When the

