 Figure 6.2
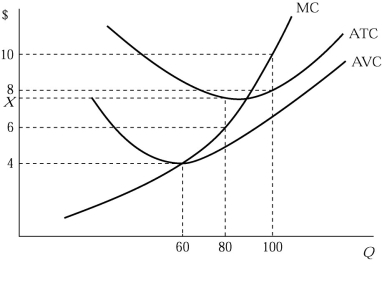
-Figure 6.2 shows the cost structure of a firm in a perfectly competitive market. Suppose that market price falls to $6. If the firm produces at an output level that causes it to suffer an economic loss of $120, its average total cost (X) is
A) $8.
B) $7.50.
C) $6.50.
D) $4.
Correct Answer:
Verified
Q67: If the market demand increases for a
Q68: If the firm is incurring losses in
Q70: If a profit-maximizing firm in a perfectly
Q70: If a profit-maximizing firm in a perfectly
Q70: If a profit-maximizing firm in a perfectly
Q73: If your firm is producing a good
Unlock this Answer For Free Now!
View this answer and more for free by performing one of the following actions

Scan the QR code to install the App and get 2 free unlocks

Unlock quizzes for free by uploading documents