 Figure 8.12
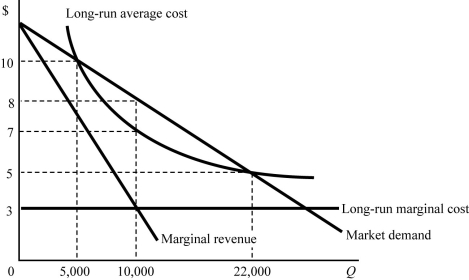
-Figure 8.12 shows a demand and costs of an unregulated monopoly. The negatively sloped long-run average cost curve reflects that
A) the firm's total cost of production decreases as its output increases.
B) the firm's profit increases as its output increases.
C) there exist large economies of scale in production.
D) All of the above are correct.
Correct Answer:
Verified
Q324: A natural monopoly arises when
A) economies of
Q325: What is a contestable market?
Q326: Q327: To maximize profit, an unregulated natural monopoly Q328: Does the threat of entry reduce the Q330: A firm is more likely to have Unlock this Answer For Free Now! View this answer and more for free by performing one of the following actions Scan the QR code to install the App and get 2 free unlocks Unlock quizzes for free by uploading documents![]()

