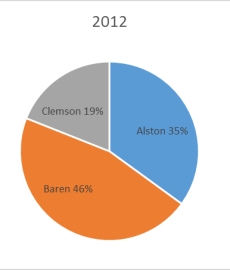
The 2010 and 2012 market share data of the three competitors (Alston, Baren, and Clemson) in an oligopolistic industry are presented in the following pie charts. Total sales for this industry were $1.5 billion in 2010 and $1.8 billion in 2012. Baren's sales in 2010 were ___. 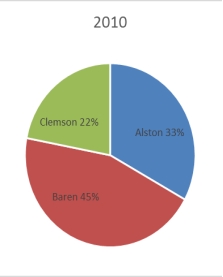
A) $342 million
B) $630 million
C) $675 million
D) $828 million
E) $928 million
Correct Answer:
Verified
Q21: Categorical data can be represented graphically by
Q24: The 2010 and 2012 market share data
Q25: According to the following graphic, "Bent Pins"
Q27: Consider the following frequency distribution:
Q27: Which of the following would be most
Q29: Categorical data
A) are always nonnumeric.
B) may be
Q30: A graph that can be used to
Q31: The 2010 and 2012 market share data
Q34: An instructor made a frequency table
Q35: Consider the following frequency distribution:
Unlock this Answer For Free Now!
View this answer and more for free by performing one of the following actions

Scan the QR code to install the App and get 2 free unlocks

Unlock quizzes for free by uploading documents