The 2010 and 2012 market share data of the three competitors (Alston, Baren, and Clemson) in an oligopolistic industry are presented in the following pie charts: 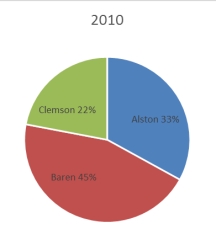
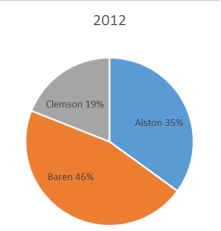
Which of the following may be a false statement?
A) Sales revenues declined at Clemson.
B) Only Clemson lost market share.
C) Alston gained market share.
D) Baren gained market share.
E) Both Alston and Baren gained market share.
Correct Answer:
Verified
Q21: Consider the following frequency distribution:
Q28: The number of phone calls arriving
Q34: An instructor has decided to graphically represent
Q35: The following graphic of PCB Failures is
Q37: Categorical data can be represented graphically by
Q37: An instructor made a frequency table
Q39: The staffs of the Accounting and the
Q39: A frequency distribution was developed.The lower endpoint
Q40: The relative frequency of a category is
Q51: Consider the relative frequency distribution given
Unlock this Answer For Free Now!
View this answer and more for free by performing one of the following actions

Scan the QR code to install the App and get 2 free unlocks

Unlock quizzes for free by uploading documents