The United Nations Development Programme website provides comparative data by country on key metrics, such metrics as life expectancy over time. The chart below shows data on life expectancy over time in the United States. 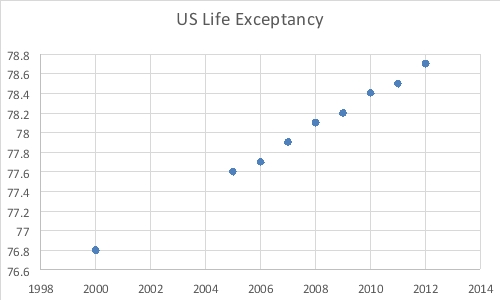 Which of the following statements are not true based on the scatterplot of U.S. Life Expectancy over time?
A) The life expectancy in the U.S. is increasing over time.
B) U.S. citizens lived fewer years in 2010 than they did in in 2008.
C) The scatterplot shows an increasing trend in life expectancy in the U.S.
D) Based on the scatterplot, one can assume the life expectancy in 2014 will be higher than 78 years.
E) Three of these statements are true.
Correct Answer:
Verified
Q42: Pinky Bauer, Chief Financial Officer of
Q76: Each day, the office staff at Oasis
Q77: Each day, the office staff at Oasis
Q78: The staff of Mr. Wayne Wertz, VP
Q79: The staff of Mr. Wayne Wertz, VP
Q82: The following graphic of residential housing data
Q83: The total energy consumption (in kWh) for
Q84: There are four majors in the School
Q85: The following graphic of residential housing data
Q86: The total energy consumption (in kWh) for
Unlock this Answer For Free Now!
View this answer and more for free by performing one of the following actions

Scan the QR code to install the App and get 2 free unlocks

Unlock quizzes for free by uploading documents