According to the following graphic, X and Y have ___. 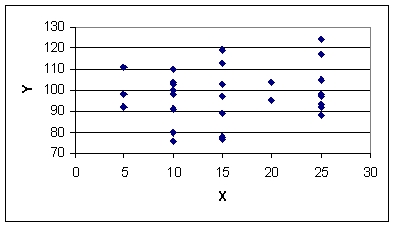
A) strong negative correlation
B) virtually no correlation
C) strong positive correlation
D) moderate negative correlation
E) weak negative correlation
Correct Answer:
Verified
Q22: Regression output from Excel software directly shows
Q25: Prediction intervals get narrower as we extrapolate
Q27: According to the following graphic, X and
Q27: Given x, a 95% prediction interval for
Q28: A t-test is used to determine whether
Q31: Regression output from Excel software includes an
Q37: The numerical value of the coefficient of
Q40: The variability in the estimated slope is
Q41: If there is positive correlation between two
Q49: If there is perfect negative correlation between
Unlock this Answer For Free Now!
View this answer and more for free by performing one of the following actions

Scan the QR code to install the App and get 2 free unlocks

Unlock quizzes for free by uploading documents