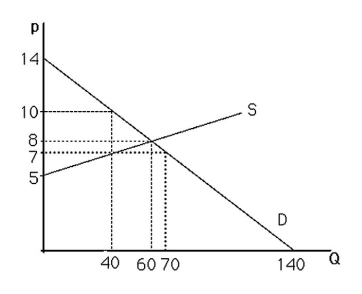
-The above figure shows a graph of the market for pizzas in a large town.If the price falls from $10 to $7 per pizza,the quantity of pizzas demanded will
A) increase by 20.
B) decrease by 30.
C) increase by 30.
D) decrease by 10.
Correct Answer:
Verified
Q7: Assuming plasma TVs are a normal good,an
Q8: Q9: Which of the following would NOT change Q10: The law of demand Q11: If the price of automobiles were to Q13: If on Tuesday the perceived price of Q14: According to the Law of Demand,the demand Q15: Consider the demand functions:A)Qd = 250 - Q16: The term "inverse demand curve" refers to Q17: Holding all other factors constant,consumers demand more![]()
A) was passed by
A)
Unlock this Answer For Free Now!
View this answer and more for free by performing one of the following actions

Scan the QR code to install the App and get 2 free unlocks

Unlock quizzes for free by uploading documents