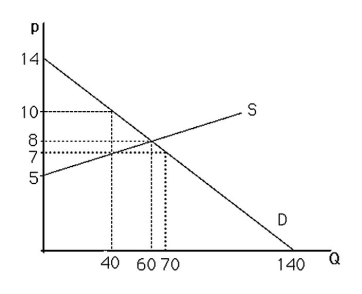
-The above figure shows a graph of the market for pizzas in a large town.If the price increases from $7 to $8 per pizza,the quantity of pizzas supplied will
A) increase by 30.
B) increase by 20.
C) decrease by 10.
D) decrease by 20.
Correct Answer:
Verified
Q52: The Law of Supply ensures that supply
Q53: Q54: Once an equilibrium is achieved,it can persist Q55: Suppose there are 100 identical firms in Q56: If two firms produce the same product Q58: Technological innovation in the production of computers Q59: If ethanol production is expected to increase Q60: Suppose society wants to increase the number Q61: At equilibrium,quantity sold equals the quantity bought.This Q62: Use supply-and-demand graphs to explain why parking![]()
Unlock this Answer For Free Now!
View this answer and more for free by performing one of the following actions

Scan the QR code to install the App and get 2 free unlocks

Unlock quizzes for free by uploading documents