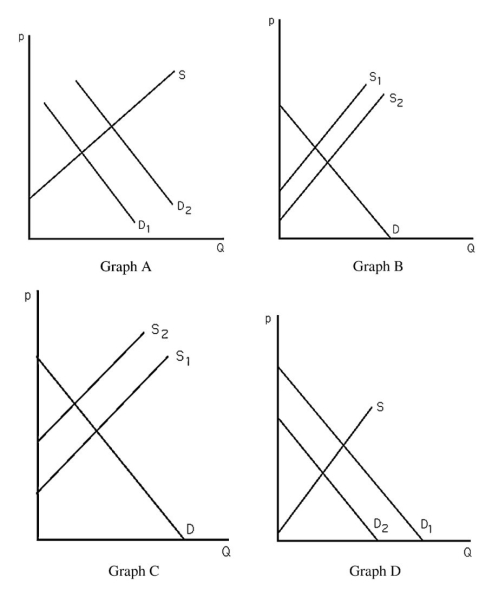
-The above figure shows four different markets with changes in either the supply curve or the demand curve.Assuming coffee and tea are substitutes,which graph best illustrates the market for tea after severe weather destroys a large portion of the coffee crop?
A) Graph A
B) Graph B
C) Graph C
D) Graph D
Correct Answer:
Verified
Q84: A drought in the Midwest will raise
Q85: Q86: If pizza and tacos are substitutes,a decrease Q87: From the 1970s through the 1990s,the relative Q88: When two goods are substitutes,a shock that Q90: What can explain the fact that DVD Q91: If government regulations increase the cost of Q92: A rightward shift of the supply curve Q93: Suppose a market were currently at equilibrium.A Q94: Explain why the equilibrium price is called![]()
Unlock this Answer For Free Now!
View this answer and more for free by performing one of the following actions

Scan the QR code to install the App and get 2 free unlocks

Unlock quizzes for free by uploading documents