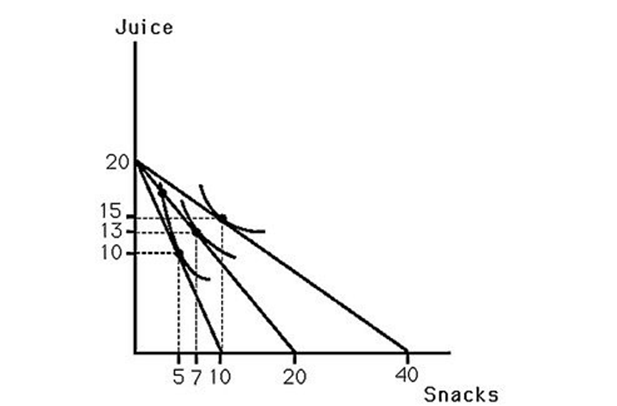
-The above figure shows Bobby's indifference map for juice and snacks.Also shown are three budget lines resulting from different prices for snacks.This information could be used to determine
A) the slope of Bobby's demand curve for juice.
B) the amount by which Bobby's demand curve for juice shifts when his income rises.
C) the amount by which Bobby's demand curve for juice shifts when the price of snacks rises.
D) All of the above.
Correct Answer:
Verified
Q5: Q6: Sandy derives utility from consuming "all other Q7: An increase in the price of a Q8: Suppose a graph is drawn to show Q9: Q11: What is the slope of the price Q12: An individual's demand curve for a good Q13: Draw two graphs,one directly above the other.On Unlock this Answer For Free Now! View this answer and more for free by performing one of the following actions Scan the QR code to install the App and get 2 free unlocks Unlock quizzes for free by uploading documents![]()
![]()

