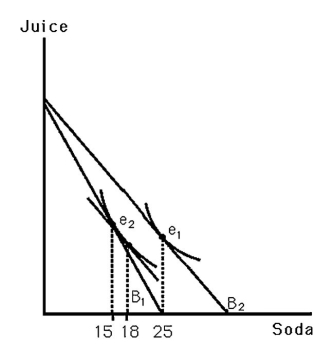
-The above figure shows Bobby's indifference map for soda and juice.B1 indicates his original budget line.B2 indicates his budget line resulting from a decrease in the price of soda.What change in quantity best represents his substitution effect?
A) 3
B) 10
C) 15
D) 7
Correct Answer:
Verified
Q55: Why can't all goods be inferior?
Q56: Why would you expect the demand for
Q57: When the price of a good changes,the
Q58: Median household income is $50,000 per year.The
Q59: Draw budget constraints,indifference curves,and the income consumption
Q61: A good may be inferior at some
Q62: The amount of money one would have
Q63: Due to inflation,nominal prices are usually
A) equal
Q64: What is the benefit of understanding the
Q65: The Affordable Care Act is intended to
Unlock this Answer For Free Now!
View this answer and more for free by performing one of the following actions

Scan the QR code to install the App and get 2 free unlocks

Unlock quizzes for free by uploading documents