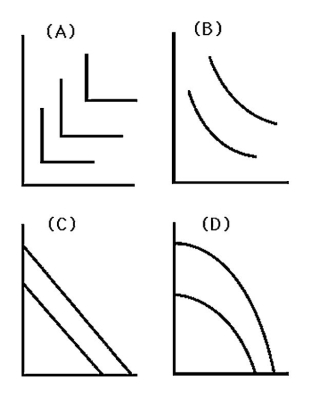
-In the above figure,Graph D with Capital on the vertical axis and labor on the horizontal axis implies that
A) the marginal product of labor is increasing as more labor is employed.
B) the marginal product of labor is decreasing as more labor is employed.
C) the capital and labor are perfect substitutes.
D) capital and labor have to be employed in fixed proportions.
Correct Answer:
Verified
Q51: The actual time length of the short
Q52: Suppose the production function for T-shirts can
Q53: Q54: Skateboards are produced according to the production Q55: A firm operating with diminishing total returns Q57: For a linear production function,q = f(L,K)= Q58: At low levels of production,marginal productivity of Q59: Each additional worker produces two extra units Q60: Describe the relationship between marginal productivity and Q61: Suppose that additional units of capital affect![]()
Unlock this Answer For Free Now!
View this answer and more for free by performing one of the following actions

Scan the QR code to install the App and get 2 free unlocks

Unlock quizzes for free by uploading documents