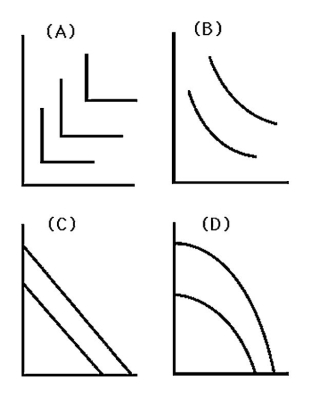
-Which graph in the above figure represents the isoquants where,as the amount of labor used increases and the amount of capital used decreases,the marginal product of labor rises when capital per day is on the vertical axis and labor per day is on the horizontal axis?
A) Graph A
B) Graph B
C) Graph C
D) Graph D
Correct Answer:
Verified
Q60: Describe the relationship between marginal productivity and
Q61: Suppose that additional units of capital affect
Q62: L-shaped isoquants imply that production requires that
Q63: If inputs into production cannot be substituted
Q64: An isoquant represents levels of capital and
Q66: How much capital does a firm require
Q67: The slope of an isoquant tells us
A)
Q68: Suppose the production of paved roadways can
Q69: Isoquants that are downward-sloping straight lines exhibit
A)
Q70: What is the MRTS for a firm
Unlock this Answer For Free Now!
View this answer and more for free by performing one of the following actions

Scan the QR code to install the App and get 2 free unlocks

Unlock quizzes for free by uploading documents