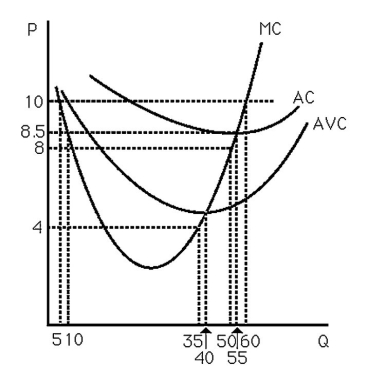
-The above figure shows the cost curves for a typical firm in a competitive market.Note that if p = 10,then MC = p at both q = 5 and q = 60.Can they both yield maximum profit? Explain.
Correct Answer:
Verified
View Answer
Unlock this answer now
Get Access to more Verified Answers free of charge
Q43: Suppose a competitive firm's total revenue is
Q44: If a profit-maximizing firm finds that,at its
Q45: If a competitive firm finds that it
Q46: Even though fixed costs do not affect
Q47: Suppose a firm has the following total
Q49: If a firm doesn't make an economic
Q50: Suppose there are 20 competitive firms in
Q51: A firm should always shut down if
Q52: If a firm goes out of business
Q53: If a firm sets marginal revenue equal
Unlock this Answer For Free Now!
View this answer and more for free by performing one of the following actions

Scan the QR code to install the App and get 2 free unlocks

Unlock quizzes for free by uploading documents