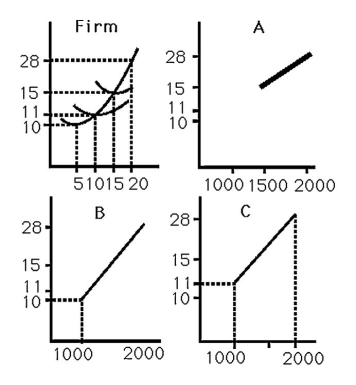
-The above figure shows the cost curves for a typical firm in a market and three possible market supply curves.If there are 100 identical firms,the market supply curve is best represented by
A) curve A.
B) curve B.
C) curve C.
D) either curve A or B, but definitely not C.
Correct Answer:
Verified
Q74: Suppose TC = 10 + (0.1 ∗
Q75: In a graph of a firm's short-run
Q76: If a competitive firm is in short-run
Q77: The reasons why a competitive firm's short-run
Q78: Suppose that once a well is dug,water
Q80: Suppose a firm's costs are F +
Q81: In deciding whether to operate in the
Unlock this Answer For Free Now!
View this answer and more for free by performing one of the following actions

Scan the QR code to install the App and get 2 free unlocks

Unlock quizzes for free by uploading documents