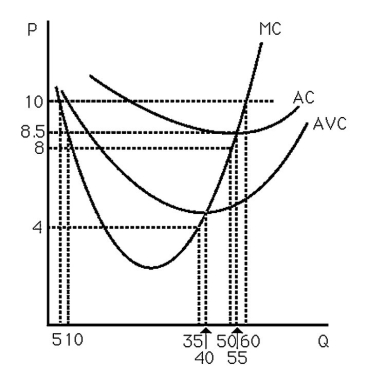
-The above figure shows the cost curves for a typical firm in a competitive market.If there are 200 identical firms,estimate the market quantity supplied when p = 4,8,and 10.
Correct Answer:
Verified
View Answer
Unlock this answer now
Get Access to more Verified Answers free of charge
Q77: The reasons why a competitive firm's short-run
Q78: Suppose that once a well is dug,water
Q79: Q80: Suppose a firm's costs are F + Q81: In deciding whether to operate in the Q83: Suppose there are 1000 identical wheat farmers.For Q84: Suppose there are two perfectly competitive industries![]()
Unlock this Answer For Free Now!
View this answer and more for free by performing one of the following actions

Scan the QR code to install the App and get 2 free unlocks

Unlock quizzes for free by uploading documents