Solved

-The Above Figure Shows Supply and Demand Curves for Apartment

Question 119

Multiple Choice

  -The above figure shows supply and demand curves for apartment units in a large city.The area  c  represents A)  the loss in consumer surplus if a rent ceiling of $350 is imposed. B)  a transfer from producers to consumers if a rent ceiling of $350 is imposed. C)  a transfer from consumers to producers if a rent ceiling of $350 is imposed. D)  the total revenue received by supplying Q1 units.
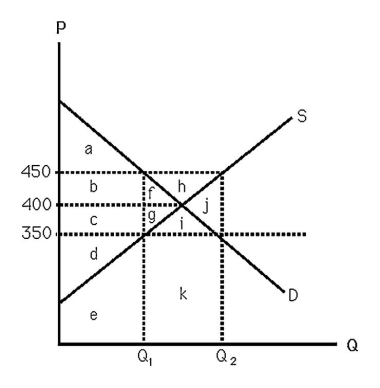
-The above figure shows supply and demand curves for apartment units in a large city.The area "c" represents


A) the loss in consumer surplus if a rent ceiling of $350 is imposed.
B) a transfer from producers to consumers if a rent ceiling of $350 is imposed.
C) a transfer from consumers to producers if a rent ceiling of $350 is imposed.
D) the total revenue received by supplying Q1 units.

Correct Answer:

verifed

Verified

Unlock this answer now
Get Access to more Verified Answers free of charge

Related Questions

Unlock this Answer For Free Now!

View this answer and more for free by performing one of the following actions

qr-code

Scan the QR code to install the App and get 2 free unlocks

upload documents

Unlock quizzes for free by uploading documents