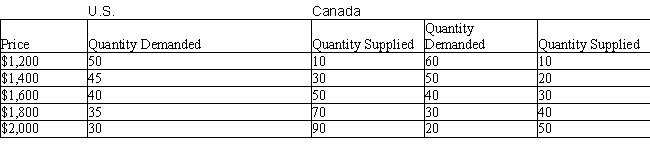
The table below shows the quantity demanded (in thousands) and quantity supplied (in thousands) of computers in the U.S. and Canada at different prices.Table 20.5
-According to economists, which of the following acts was partially responsible for the Great Depression of the 1930s?
A) The Robinson-Patman Act
B) The National Recovery Act
C) The Smoot-Hawley Tariff Act
D) The Sarbanes-Oxley Act
E) The Sherman Antitrust Act
Correct Answer:
Verified
Q28: The figure below shows the demand (D)
Q29: The table below shows the quantity demanded
Q30: The table below shows the quantity demanded
Q31: The table below shows the quantity demanded
Q32: The table below shows the quantity demanded
Q34: The figure below shows the demand (D)
Q35: The table below shows the quantity demanded
Q36: The table below shows the quantity demanded
Q37: The table below shows the quantity demanded
Q38: The table below shows the quantity demanded
Unlock this Answer For Free Now!
View this answer and more for free by performing one of the following actions

Scan the QR code to install the App and get 2 free unlocks

Unlock quizzes for free by uploading documents