The figure given below depicts the negatively sloped demand and positively sloped supply curves of wheat in a country. Figure 21.2 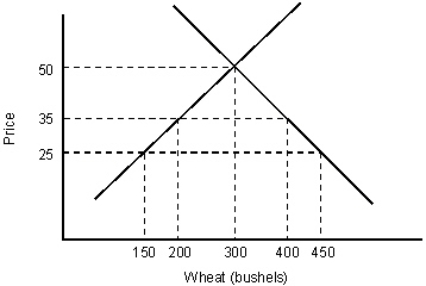
- In Figure 21.2,if the world price per bushel of wheat is $25,and a tariff of $10 is imposed,what is the domestic production?
A) 300 bushels
B) 450 bushels
C) 400 bushels
D) 150 bushels
E) 200 bushels
Correct Answer:
Verified
Q55: The figure below shows the demand (D)
Q56: Which of the following countries is forbidden
Q57: The figure given below depicts the negatively
Q58: The figure given below depicts the negatively
Q59: The figure given below depicts the negatively
Q62: The figure below shows the demand (D)
Q63: As a result of the government procurement
Q64: One of the negative impacts of export
Q65: Agreements to abolish most barriers to trade
Q77: The figure below shows the demand (D)
Unlock this Answer For Free Now!
View this answer and more for free by performing one of the following actions

Scan the QR code to install the App and get 2 free unlocks

Unlock quizzes for free by uploading documents