The figure below shows the demand (D) and supply (S) curves of corn syrups. Figure 21.3 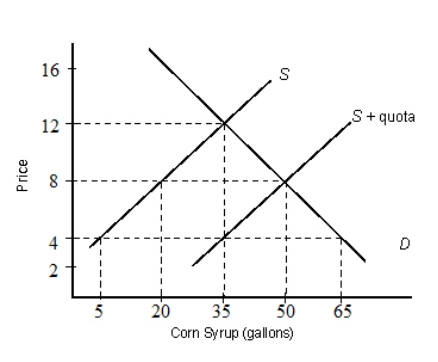
- In Figure 21.3,suppose an import quota of 30 gallons of corn syrup is imposed.If the world price per gallon is $4:
A) there will be an excess domestic demand of approximately 35 gallons.
B) the domestic market will be in equilibrium.
C) there will be an excess domestic demand for 10 gallons.
D) there will be an excess supply of 20 gallons.
E) there will be an excess domestic demand for 20 gallons.
Correct Answer:
Verified
Q47: The figure below shows the demand (D)
Q48: The figure given below depicts the negatively
Q49: By restricting the amount of a good
Q50: The figure given below depicts the negatively
Q51: The figure given below depicts the negatively
Q55: The figure below shows the demand (D)
Q56: The figure below shows the demand (D)
Q56: Which of the following countries is forbidden
Q57: The figure given below depicts the negatively
Q60: The figure given below depicts the negatively
Unlock this Answer For Free Now!
View this answer and more for free by performing one of the following actions

Scan the QR code to install the App and get 2 free unlocks

Unlock quizzes for free by uploading documents