The figure below shows the demand (D) and supply (S) curves of corn syrups. Figure 21.3 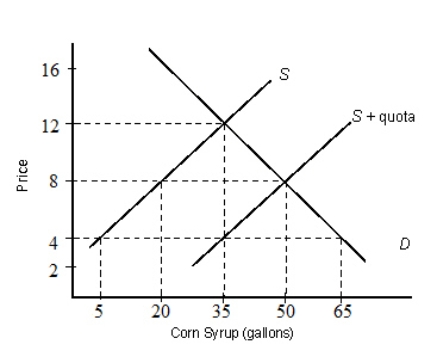
- In Figure 21.3,if the world price per gallon is $8,then without quotas:
A) 50 gallons of corn syrup will be imported.
B) 35 gallons of corn syrup will be imported.
C) 30 gallons of corn syrup will be imported.
D) 20 gallons of corn syrup will be imported.
E) 45 gallons of corn syrup will be imported.
Correct Answer:
Verified
Q27: The figure below shows the demand (D)
Q33: The table below shows the quantity demanded
Q36: The table below shows the quantity demanded
Q36: According to strategic trade policy,international trade largely
Q40: The figure below shows the demand (D)
Q42: The figure below shows the demand (D)
Q43: The figure given below depicts the negatively
Q44: The figure given below depicts the negatively
Q45: Suppose that the world price of kiwi
Q46: The figure given below depicts the negatively
Unlock this Answer For Free Now!
View this answer and more for free by performing one of the following actions

Scan the QR code to install the App and get 2 free unlocks

Unlock quizzes for free by uploading documents