The figure below shows the demand (D) and supply (S) curves of cocoa in the U.S. Figure 21.4 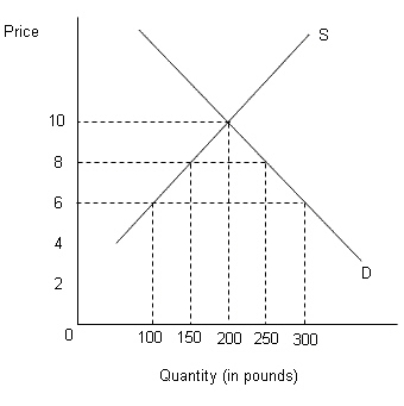
-According to Figure 21.4,the no-trade equilibrium price and quantity of cocoa in the U.S.market are:
A) $8 and 150 pounds.
B) $10 and 250 pounds.
C) $4 and 200 pounds.
D) $10 and 200 pounds.
E) $6 and 300 pounds.
Correct Answer:
Verified
Q71: Trade diversion reduces worldwide efficiency,because:
A)production is diverted
Q72: The trade-creation effect refers to:
A)a reduction in
Q74: The basic difference between a tariff and
Q75: Subsidies are payments made by the government
Q76: The figure below shows the demand (D)
Q77: The figure below shows the demand (D)
Q78: The figure below shows the demand (D)
Q78: A customs union is an organization of
Q79: In 1992 the EEC was replaced by
Q97: The figure below shows the demand (D)
Unlock this Answer For Free Now!
View this answer and more for free by performing one of the following actions

Scan the QR code to install the App and get 2 free unlocks

Unlock quizzes for free by uploading documents