The figure below shows the demand (D) and supply (S) curves of cocoa in the U.S. Figure 21.4 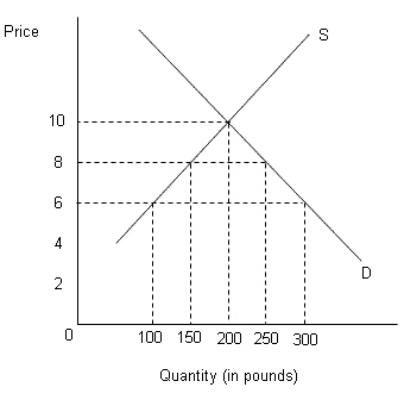
- Refer to Figure 21.4.If cocoa sells for $6 per pound in the world market,determine the volume of U.S.cocoa imports.
A) 250 pounds
B) 350 pounds
C) 300 pounds
D) 150 pounds
E) 200 pounds
Correct Answer:
Verified
Q63: As a result of the government procurement
Q63: The figure below shows the demand (D)
Q64: One of the negative impacts of export
Q65: Agreements to abolish most barriers to trade
Q66: Suppose,in the United States,each farmer is given
Q68: The most successful free trade agreements achieve
Q69: The figure below shows the demand (D)
Q71: Trade diversion reduces worldwide efficiency,because:
A)production is diverted
Q72: The trade-creation effect refers to:
A)a reduction in
Q77: The figure below shows the demand (D)
Unlock this Answer For Free Now!
View this answer and more for free by performing one of the following actions

Scan the QR code to install the App and get 2 free unlocks

Unlock quizzes for free by uploading documents