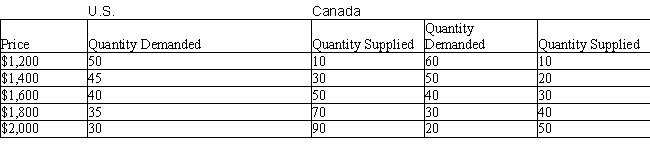
The table below shows the quantity demanded (in thousands) and quantity supplied (in thousands) of computers in the U.S. and Canada at different prices.Table 20.5
-The original comparative advantage model that used the relative abundance of factors of production to explain comparative advantage assumed that countries:
A) employed all four factors of production; land, labor, capital, and entrepreneurship.
B) employed only two factors of production; labor and capital.
C) employed only two factors of production; land and entrepreneurial ability.
D) worked with a fixed capital stock.
E) were free to vary their employment of only one factor of production; labor.
Correct Answer:
Verified
Q57: The following table shows that in one
Q58: Scenario 20.2
Suppose labor productivity differences are the
Q59: The first panel in the following figure
Q60: Scenario 20.2
Suppose labor productivity differences are the
Q61: The table below shows the quantity demanded
Q63: The table below shows the quantity demanded
Q64: The table below shows the quantity demanded
Q65: The figure given below shows the import
Q66: The table below shows the quantity demanded
Q67: The table below shows the quantity demanded
Unlock this Answer For Free Now!
View this answer and more for free by performing one of the following actions

Scan the QR code to install the App and get 2 free unlocks

Unlock quizzes for free by uploading documents