The figure given below shows the Lorenz curves of two countries (Country A and Country B) . Figure 19.2
Total income (cumulative percentage) 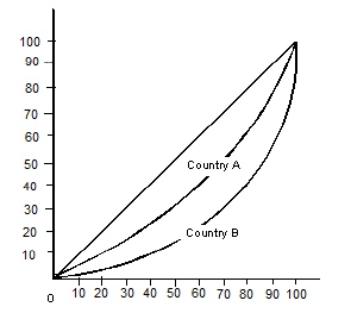 Total population (cumuative percentage)
-In Figure 19.2,the richest 20 percent of the population in Country B receive:
A) 20 percent of the national income.
B) 60 percent of the national income.
C) 50 percent of the national income.
D) 40 percent of the national income.
E) 80 percent of the national income.
Correct Answer:
Verified
Q25: The figure given below shows the Lorenz
Q27: The figure given below shows the Lorenz
Q29: The figure given below shows the Lorenz
Q34: The figure given below shows the Lorenz
Q38: The figure below shows two Lorenz curves,Y
Q38: The figure given below shows the Lorenz
Q41: In a progressive tax structure:
A)both the tax
Q43: The table given below shows the absolute
Q45: The table given below shows the absolute
Q47: The figure given below shows the Lorenz
Unlock this Answer For Free Now!
View this answer and more for free by performing one of the following actions

Scan the QR code to install the App and get 2 free unlocks

Unlock quizzes for free by uploading documents