The figure given below shows the demand (D1 and D2) and supply (S) curves of medical care. Figure 18.1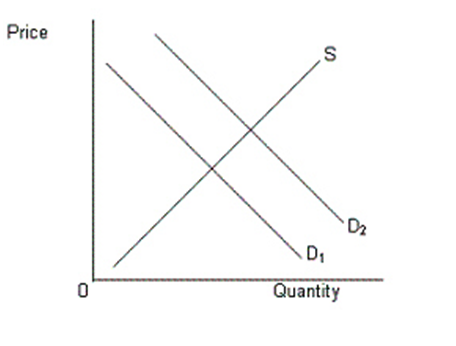
-Refer to Figure 18.1.The possible reason behind the shift of the supply curve from S1 to S2 is:
A) increased preference for herbal medicine among the people.
B) increase in the marginal cost of producing medical care.
C) increase in the per capita income of the people.
D) economies of scale being experienced in the production of medical care.
E) greater health consciousness among the people.
Correct Answer:
Verified
Q16: Which of the following is the most
Q17: Which of the following factors are responsible
Q18: Which of the following would not reduce
Q19: The aging of the American population has
Q20: One of the major impacts of the
Q22: Which of the following can increase the
Q23: The figure given below shows the demand
Q24: Medicare is a federal program that provides
Q25: Which of the following has led to
Q26: The American Medical Association helps increase:
A)price competition
Unlock this Answer For Free Now!
View this answer and more for free by performing one of the following actions

Scan the QR code to install the App and get 2 free unlocks

Unlock quizzes for free by uploading documents