The figure given below represents demand for and supply of hospital beds in Anytown,U.S.A.,as shown by curves D and S1 in the following figure.If the hospital receives permission to expand,its new supply curve will be S2.Price level P1 is the fixed prospective payment reimbursement rate paid by Medicare to the hospital,regardless of actual cost. Figure 18.3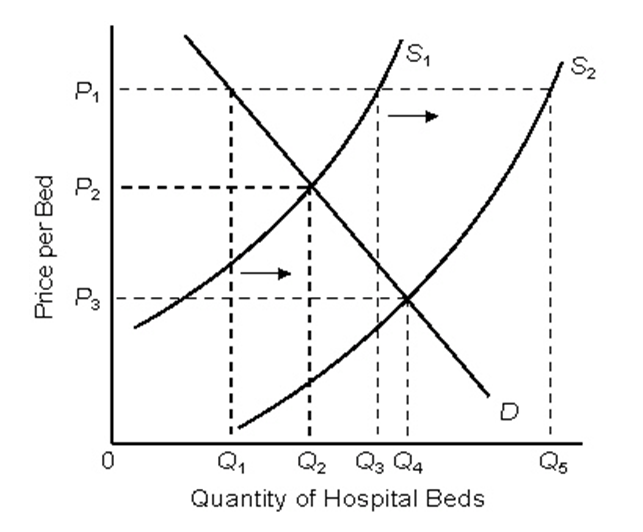
-According to Figure 18.3,the surplus of beds caused by the fixed reimbursement rate,before the hospital expansion,is the difference between _____ and _____.
A) Q2; Q1
B) Q4; Q1
C) Q4; Q2
D) Q3; Q1
E) Q3; Q2
Correct Answer:
Verified
Q22: Which of the following can increase the
Q23: The figure given below shows the demand
Q24: Medicare is a federal program that provides
Q25: Which of the following has led to
Q26: The American Medical Association helps increase:
A)price competition
Q28: The increase in physicians' fees in the
Q29: _ account for a majority of the
Q30: The bulk of the cost of hospital
Q31: What is the effect of the aging
Q32: Which of the following statements about Medicare
Unlock this Answer For Free Now!
View this answer and more for free by performing one of the following actions

Scan the QR code to install the App and get 2 free unlocks

Unlock quizzes for free by uploading documents