The figure given below represents an imperfectly competitive resource market.Here common land (and not land used for specific purpose) is under consideration. Figure 17.1 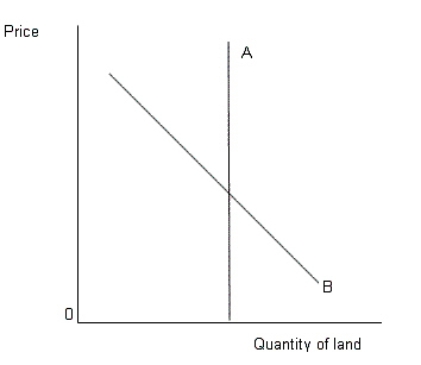
- In Figure 17.1,the curve A indicates:
A) demand curve for land.
B) supply curve of land.
C) marginal factor cost of land.
D) marginal revenue product curve for land.
E) value of marginal product curve of land.
Correct Answer:
Verified
Q1: The earnings of which of the following
Q4: When does the entire earning of a
Q6: The marginal cost of extraction of a
Q7: The category of resources economists call "land"
Q8: In the market for land as a
Q9: For any particular period of time,say a
Q11: Lobbying efforts by individuals and firms:
A)increase productive
Q12: The figure given below shows the demand
Q13: The figure given below shows the demand
Q18: The figure given below represents an imperfectly
Unlock this Answer For Free Now!
View this answer and more for free by performing one of the following actions

Scan the QR code to install the App and get 2 free unlocks

Unlock quizzes for free by uploading documents