The figure given below represents an imperfectly competitive resource market.Here common land (and not land used for specific purpose) is under consideration. Figure 17.1 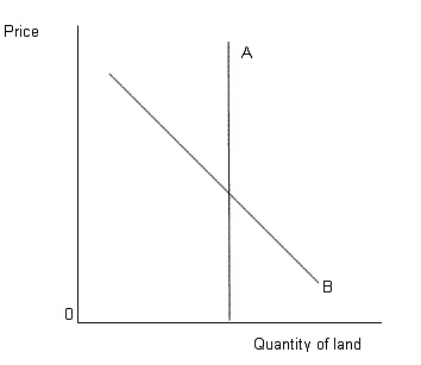
- In Figure 17.1,the curve B indicates:
A) supply curve of land.
B) marginal revenue product curve for land.
C) value of marginal product curve of land.
D) marginal factor cost curve of land.
E) marginal product curve of land.
Correct Answer:
Verified
Q1: The figure given below shows the demand
Q3: The figure given below shows the demand
Q10: The figure given below represents an imperfectly
Q11: The figure given below represents an imperfectly
Q14: The figure given below shows the demand
Q19: Unproductive actions designed to increase income or
Q20: For resources with upward-sloping supply curves:
A)earnings consist
Q21: Common ownership of resources:
A)is a system by
Q34: The figure given below represents an imperfectly
Q39: The figure given below represents an imperfectly
Unlock this Answer For Free Now!
View this answer and more for free by performing one of the following actions

Scan the QR code to install the App and get 2 free unlocks

Unlock quizzes for free by uploading documents