The figure below shows the supply curve for labor. Figure 15.1 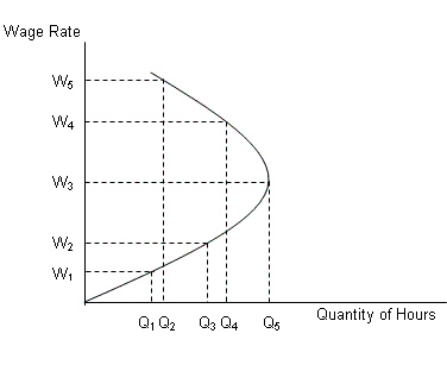
- Refer to Figure 15.1.When wage rate increases from W2 to W3 :
A) quantity of labor supplied increases from Q2 to Q4.
B) quantity of labor supplied decreases from Q3 to Q4.
C) quantity of labor supplied increases from Q4 to Q5.
D) quantity of labor supplied decreases from Q2 to Q4.
E) quantity of labor supplied increases from Q3 to Q5.
Correct Answer:
Verified
Q12: The figure below shows the supply curve
Q15: The figure given below shows the demand
Q16: Which of the following is a true
Q17: The term compensating wage differential refers to:
A)the
Q19: The figure given below shows the demand
Q20: As the wage rate increases,the quantity supplied
Q21: The figure given below shows the demand
Q23: The intention of a minimum wage is
Q24: Minimum wage legislation by the government would:
A)create
Q36: The figures given below show the demand
Unlock this Answer For Free Now!
View this answer and more for free by performing one of the following actions

Scan the QR code to install the App and get 2 free unlocks

Unlock quizzes for free by uploading documents